ROC Curve
Table of contents
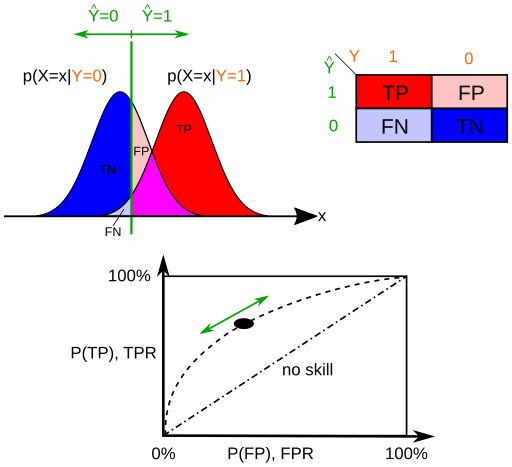
Errors in classfication
In machine learning, classifiers cannot be perfect and there will be errors.

There is usually a trade-off between sensitivity and specificity.
You may attempt to reduce as many false negatives in expense of false positives, or reduce false positives in expense of false negatives. This decision, or threshold, depends on the domain and the business decision.
Quick Recap of Terms
- False Positive Rate (FPR) = $\frac{FP}{FP + TN}$
- Among the negatives, how many were incorrectly classified as positives?
- The probability of false positive is often called $\alpha$ or Type I error.
- False Negative Rate (FNR) = $\frac{FN}{TP + FN}$
- Among the positives, how many were incorrectly classified as negatives?
- The probability of false negative is often called $\beta$ or Type II error.
- Sensitivity (Recall, True Positive Rate) = $1 - FNR$
- Specificity (True Negative Rate) = $1 - FPR$
Receiver Operating Characteristic (ROC) Curve
Because threshold is up to discretion, we need a threshold-invariant way to evaluate the model.
We use the ROC curve to do so.
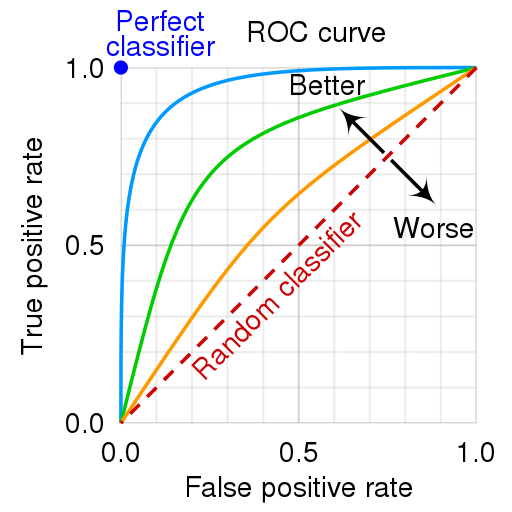
The basic idea is, as we tweak the classifier’s threshold, we plot the True Positive Rate (sensitivity) against the False Positive Rate.
\[TPR \text{ (recall)} = \frac{TP}{TP+FN}\] \[FPR = \frac{FP}{FP + TN} = 1 - TNR \text{ (specificity)}\]The collection of these points will form a curve for that classifier.
Each point on the ROC curve is a performance measure of a threshold.
Area under the curve (AUC)
The red dotted line indicates a curve of a random classifier which just randomly assigns classes with a uniform distribution.
Any sane classifier should be above this line.
For any classifier above the random classifier, the number of correctly classified positives is greater than the number of incorrectly classified positives.
Area under the curve (AUC) ($\le 1$) is an aggregate performance measure across all thresholds of a model.
Higher AUC indicates higher accuracy of the model.
AUC is a useful metric even when the class distributions are highly unbalanced.
AUC is for comparing models not thresholds.
Selecting the threshold
In every classification problem, a business decision must be made.
Which of the two are more detrimental?
If the normal/abnormal classification was performed in a medical setting, a False Negative might be a patient who is diagnosed as normal, but is actually sick.
Here we prefer to avoid False Negatives (or maximize True Positives) at the expense of more False Positives.
In the below figure, think about moving the green bar to the far left.
However, if the classification was about whether an email is spam or not, we’d pretty much prefer spam mails occasionally ending up in your inbox rather than having your job offer email sent to spam.
In this case, we prefer to avoid False Positives at the expense of more False Negatives.
In the below figure, think about moving the green bar to the far right.
The business decision at hand is then:
- Maximize True Positive Rate
- Minimize False Positive Rate
The ROC curve is a visual illustration of the impact of different thresholds and helps you make these business decisions.
If you increase the threshold towards right, the point on the ROC curve moves towards bottom left, because $FP$ decreases.
If you decrease the threshold towards left, the point on the ROC curve moves towards top right, because $TP$ increases.
PR Curve using precision
Sometimes the curve is drawn with recall (TPR, sensitivity) and precision (PPV) instead.
\[precision = \frac{TP}{TP + FP}\] \[FPR = \frac{FP}{N} = \frac{FP}{TN+FP}\]Suppose the number of actual Condition Negative ($N$) dominates ($N \rightarrow \infty$; high imbalance towards class Negative).
As you can see from the equation, while precision is significantly affected by the number of False Positives regardless, FPR does not change as much if $N$ is too large.
Therefore, if the class distributions are highly imbalanced, precision may be more sensitive to False Positives than FPR.

AUC for ROC curve is sometimes called AUROC and AUC for PR curve is called AUPR.
Both AUC metrics bear analogous meaning: higher the better.
If you increase the threshold towards right, the point on PR curve moves top left.
References:
- Ten quick tips for machine learning in computational biology - Scientific Figure on ResearchGate. Available from: https://www.researchgate.net/figure/a-Example-of-Precision-Recall-curve-with-the-precision-score-on-the-y-axis-and-the_fig1_321672019 [accessed 4 Dec, 2021]