Seasonality
Seasonality is a characteristic of time series data where the data exhibits a repeating pattern at regular intervals (e.g. higher number of visitors on weekends, etc).
The most intuitive way to notice seasonality is to visualize the data. However, the type of plot you use can affect how you perceive seasonality. Sometimes it is harder to notice seasonality with a scatter plot than with a line plot.
Aside from visualization, there are other statistical methods to detect seasonality.
Table of contents
Difference between seasonality and cyclicity
They are similar in that they both exhibit a repeating pattern. However, cyclicity has variable periods.
Different types of time series models
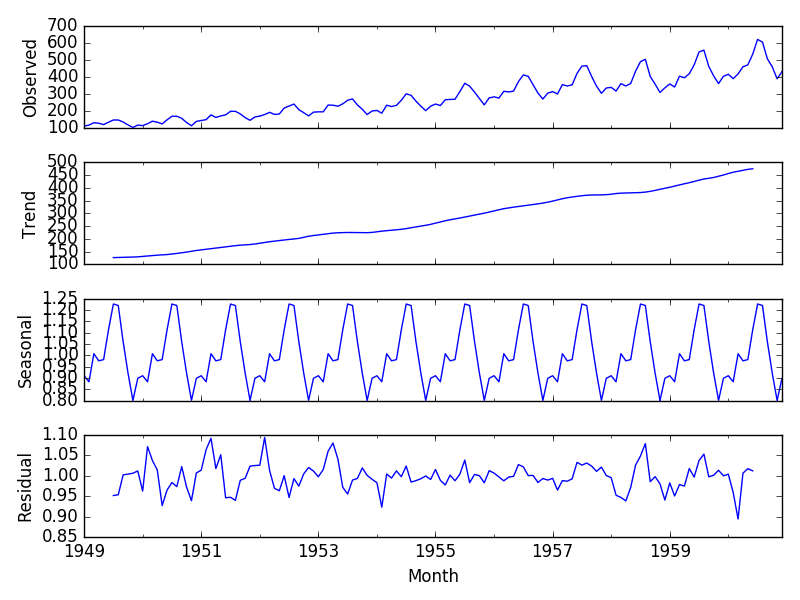
A time series data can be thought of as a combination of
- Level (average)
- Trend (upward or downward movement)
- Seasonality (repeating pattern)
- Residual (random noise)
We must first identify how these components combine to form the data. Then we can use the appropriate decomposition model to extract seasonality.
Additive model
If a time series data is best modeled by adding the above components, then it is called an additive model.
$$ y = \text{Level} + \text{Trend} + \text{Seasonality} + \text{Residual} $$
Multiplicative model
If a time series data is best modeled by multiplying the above components, then it is called a multiplicative model.
$$ y = \text{Level} \times \text{Trend} \times \text{Seasonality} \times \text{Residual} $$
Decomposition