Type I and Type II Errors
Table of contents
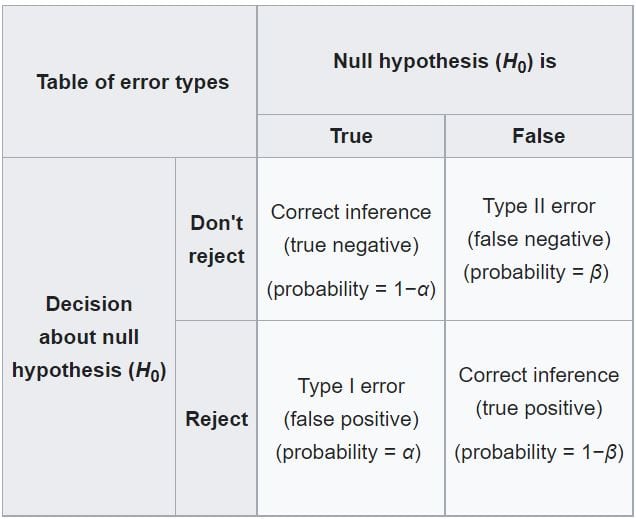
Truth Table
In hypothesis testing, we have two truths:
- Null hypothesis ($H_0$) is true
- Alternative hypothesis ($H_a$) is true
Based on the results of the test, we make two decisions:
- Reject the null hypothesis
- Fail to reject the null hypothesis
Then we have a truth table of the following:
Type I Error
Type I error is when we reject the null hypothesis when it is actually true.
Type I error is also called false positive.
Why is Type I error called false positive?
Remember that alternatitve hypothesis is what we want to prove. Try to see things from the perspective of the alternative hypothesis.
By rejecting the null hypothesis, we’re basically saying yes (positive) to our alternative hypothesis that is actually false.
Because we do not actually know the true state of the world, it is techinally impossible to know whether we have made a Type I error.
However, we can control the probability of making a Type I error.
Remember that we reject the null hypothesis when:
$$ p < \alpha $$
Therefore, if we fix the value of $\alpha$, we can control the probability of making a Type I error.
So when we say $\alpha = 0.05$, it means that we are willing to accept a 5% chance of making a Type I error.
Type II Error
Type II error is when we fail to reject the null hypothesis when it is actually false.
Type II error is also called false negative.
Why is Type II error called false negative?
Our alternative hypothesis was actually true, but we fail to confirm it / end up saying “no” (negative).
The probability of making a Type II error is denoted by $\beta$.
Power of Test

The power of test is the probability of rejecting the null hypothesis when it is actually false.
It is denoted by:
$$ 1 - \beta $$
The power of test is the probability of not making a Type II error.
The most common power of test is $80\%$. However, unlike $\alpha$, we cannot control the value of $\beta$ directly.
There are a few factors that affect the power of test:
- Sample size: larger sample size $\rightarrow$ higher power
- Higher sample size reduces variance, which in turn reduces overlap
- Effect size: larger effect size $\rightarrow$ higher power
Keeping these factors in mind, we instead try to design our experiment so that we have a desired $1 - \beta$.
Power Function
The power of a test is the probability of rejecting the null hypothesis when the alternative hypothesis is true.
When do we reject the null hypothesis? When the test statistic is in the rejection region:
\[\Pr(X \in R)\]However, this probability is dependent on the true parameter $\theta$, because $\theta$ determines the position and shape of the distributions, and thus the overlap.
Example
For example, if we have a normal distribution with mean $\mu$, the power of test becomes the form of:
\[1 - \Phi(z)\]where $\Phi$ is the CDF of the standard normal distribution.
The $z$-score is a function of the true mean $\mu$, therefore the power of test for a normal distribution is a function of $\mu$.
Therefore, to emphasize the dependence on $\theta$, we can express the power of test as a function of $\theta$:
$$ B(\theta) = \Pr(X \in R; \theta) $$
Effect Size
Effect size measures the relationship between two variables.
Calculating the effect size depends on the type of test we are performing.
For a t-test on the difference between two means, the effect size becomes the standardized difference between the two means or the Cohen’s d:
$$ d = \frac{\mu_A - \mu_B}{\sigma} $$
For other tests, we can use other measures of effect size.
It is important to pre-determine a relevant effect size (i.e. the blood pressure must decrease by a certain amount) before starting an experiment.
Otherwise, depending on how we design our experiment, we might end up with a positive result even though the effect is not significant (i.e. miniscule reduction in blood pressure).
Relationship between $\alpha$ and $\beta$
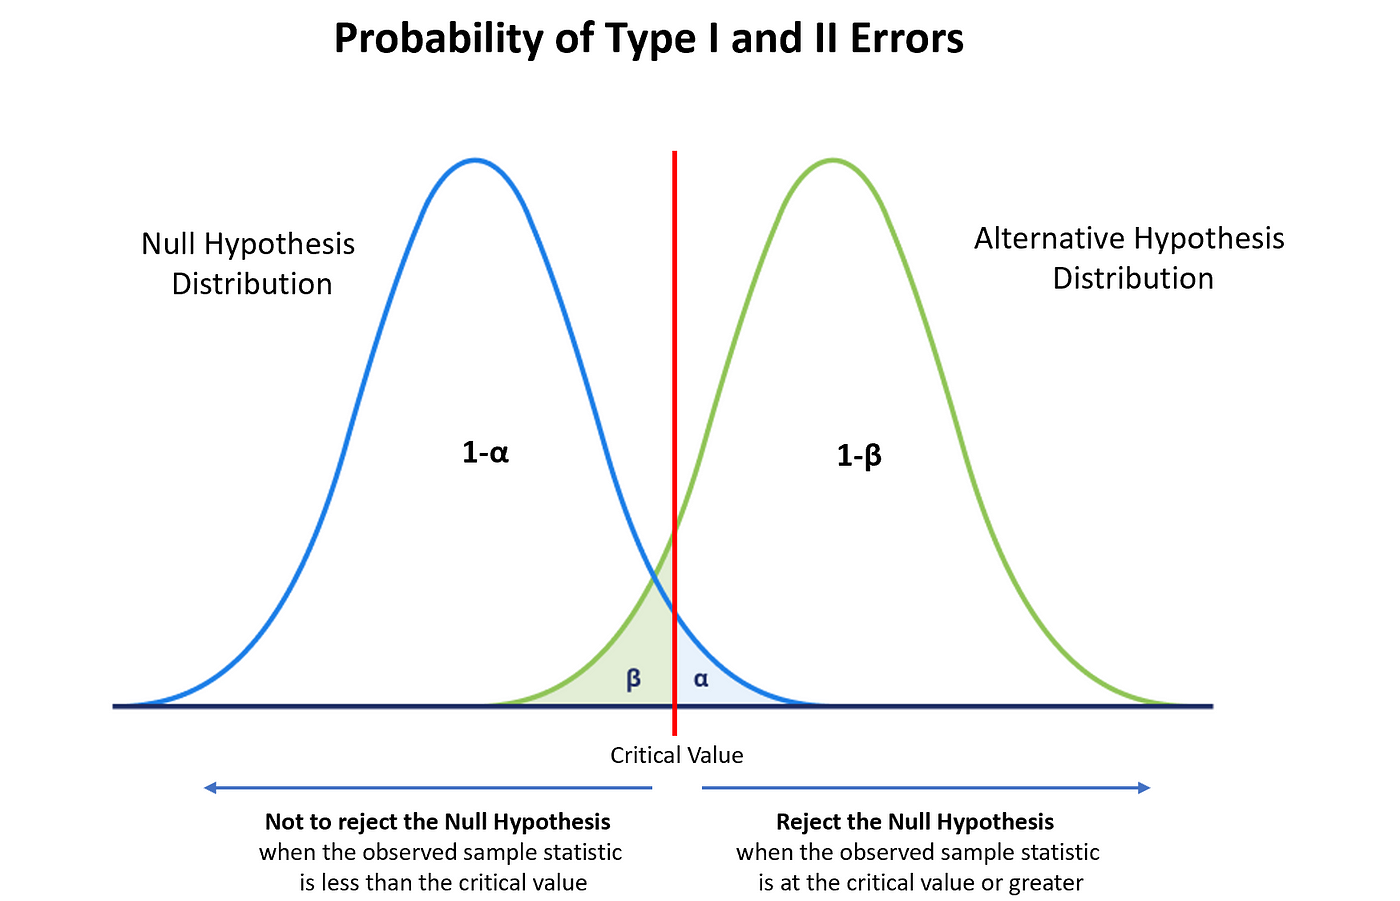
Ideally, we’d want to have both $\alpha$ and $\beta$ to be small.
However, there is a trade-off between the two.
If we try to reduce our false positive rate $\alpha$, we will end up increasing our false negative rate $\beta$.
Sample Size Planning
$\alpha$, $\beta$, sample size $n$, and effect size are all related.
There is a property that, if we fix any three of the four, the last one is pre-determined.
When we plan an experiment, we usually have a desired $\alpha$, $\beta$, and effect size in mind.
Then we can calculate the required sample size $n$.