Comparing Means in Parametric Tests
With parametric tests, we often compare the representative value mean against a hypothesis.
This page describes different methods of comparing means in parametric tests.
You don’t have to know all the equations by heart because most of the time you will be using a software to do the calculations for you.
However, it is important to know the differences between the methods and when to use which method.
Table of contents
One-Sample t-Test
One-sample t-test is a hypothesis test that determines an unknown mean of a population which the sample is drawn from.
Because we use a t-distribution, we need to assume the normality of the population.
For some value $m$, our null hypothesis would be:
$$ H_0: \mu = m $$
And our alternative hypothesis:
$$ H_A: \mu \ne m $$
If $p < \alpha$, we would conclude that the population mean is unlikely to be $m$.
It is important to note that the value $m$ must be selected so that it serves as a meaningful value to the researcher (there should be a reason why we chose $m$).
For example, if we were testing for the population’s average height, there’s no point in just choosing $m = 170cm$, because that’s an arbitrary value.
In this case, we are actually better off just calculating a confidence interval for the population mean.
However, if there was a better reasoning behind $m = 170cm$ (such as, average height in a certain country was 170cm and we want to test if it is the same in this country), then our hypothesis test would be more meaningful.
Calculation
- We assume $H_0$ is true and thus $\mu = m$
- Calculate the sample mean $\bar{x}$ and subtract $m$ to get $\bar{x} - \mu$.
- Calculate the sample standard deviation $s$
- Calculate the standard error of the mean $\text{SEM} = s/\sqrt{n}$
- Calculate the t-statistic $t = (\bar{x} - m) / \text{SEM}$
- Obtain the t-score $t_{\alpha/2, \nu}$ (where $\nu = n - 1$ is the degrees of freedom)
- If our $t$ does not fall within the range $-t_{\alpha/2, \nu} \le t \le t_{\alpha/2, \nu}$, we know that $p < \alpha$ and thus we reject $H_0$.
Paired t-Test
Paired t-test is a hypothesis test that compares the means of two populations that are related in some way.
Most common case is comparing the data of identical subjects before and after a treatment.
This might seem like a new testing method, but it is actually just a special case of one-sample t-test.
Instead of setting up a null hypothesis on the population mean, we set up a null hypothesis on the difference between the means before/after.
Consider the following table:
| Subject | Before | After | Difference |
|---|---|---|---|
| A | 10 | 12 | 2 |
| B | 10 | 14 | 4 |
| C | 12 | 14 | 2 |
| D | 11 | 15 | 4 |
Let $X_0$ be the population of the data before the treatment, and $X_1$ be the population of the data after the treatment.
Then our null hypothesis would be on the $\Delta X = X_1 - X_0$:
$$ H_0: \mu_{\Delta X} = 0 $$
I won’t go into the details of the calculation, but following the same steps as one-sample t-test, you will find that our difference in the table above is significantly different from 0 (with $\alpha = 0.05$).
You may wonder if we can just use a two-sample t-test (described below) to compare the means before/after.
However, the problem is that the samples are not independent of each other, and this makes the two-sample t-test more prone to errors.
When suitable, paired t-test has more power than two-sample t-test.
Two-Sample t-Test
Two-sample t-test is a hypothesis test that compares the means of two populations.
The populations must have normality.
Two-sample t-test is also known as unpaired t-test or independent t-test, where the samples are independent of each other.
Our null hypothesis would be:
$$ H_0: \mu_A = \mu_B $$
And our alternative hypothesis:
$$ H_A: \mu_A \ne \mu_B $$
Pooled Standard Deviation
Pooled standard deviation is the weighted average of standard deviations of two or more sample groups.
Larger samples are given more weight.
We typically denote the pooled standard deviation as:
$$ s_p $$
The unbiased pooled standard deviation for $k$ samples is:
$$ s_p = \sqrt{\frac{\sum_{i=1}^k (n_i - 1) s_i^2}{\sum_{i=1}^k n_i}} $$
For equal sample sizes, the pooled standard deviation is simplified to:
$$ s_p = \sqrt{\frac{\sum_{i=1}^k s_i^2}{k}} $$
If sample size and sample standard deviation are the same for all samples, then the pooled standard deviation is the same as the sample standard deviation. Confirm this by plugging in $s_i = s$ for all $i$.
Homogeneity of Variance
When we perform a two-sample t-test, we generally assume that the two populations have the same variance.
However, if this assumption cannot be met, we use a modified version of the t-test called Welch’s t-test.
Normality is still assumed.
t-Statistic for Two Independent Samples
For two-sample t-test where we assume equal population variance, we use the following formula for the t-statistic:
$$ \begin{equation} \label{eq:t-two-sample-homovar} t = \frac{(\bar{x}_A - \bar{x}_B) - (\mu_A - \mu_B)} {s_p \sqrt{\frac{1}{n_A} + \frac{1}{n_B}}} \end{equation} $$
And if we have a similar sample size $n_A = n_B = n$, the formula can be further simplified to:
$$ \begin{equation} \label{eq:t-two-sample-simple} t = \frac{(\bar{x}_A - \bar{x}_B) - (\mu_A - \mu_B)}{s_p \sqrt{2/n}} \end{equation} $$
Degrees of Freedom
The degrees of freedom $\nu$ for two-sample t-test is:
$$ \nu = n_A + n_B - 2 $$
Two freedom are lost because we use our sample standard deviations to estimate the population standard deviations (pooled standard deviation).
Calculation
- We assume $H_0$ is true and thus $\mu_A - \mu_B = 0$
- Calculate the sample standard deviation $s_A$ and $s_B$
- Calculate the pooled standard deviation $s_p$ where $k = 2$
- Calculate the t-statistic $t$ using Equation \eqref{eq:t-two-sample-homovar} with $\mu_A - \mu_B = 0$ substituted in
- Obtain the t-score $t_{\alpha/2, \nu}$ (where $\nu = n_A + n_B - 2$ is the degrees of freedom)
- If our $t$ does not fall within the range $-t_{\alpha/2, \nu} \le t \le t_{\alpha/2, \nu}$, we know that $p < \alpha$ and thus we reject $H_0$.
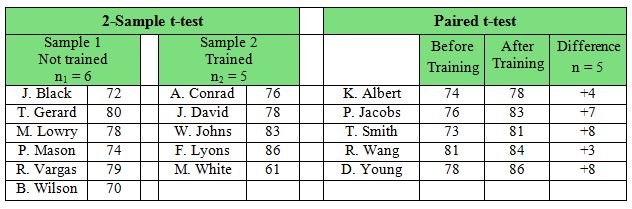
Paired t-Test vs. Unpaired t-Test
For a recap, paired t-test is used when we have two samples that are dependent on each other, while unpaired t-test is used when we have two samples that are independent.
The following figure illustrates in which situations either test should be used:
When applicable, it is always better to use paired t-test because it has more power.
Just because there are two samples that need to be compared, it does not mean two-sample t-test is most appropriate.
We should always consider the nature and relationship of the samples before deciding a testing method.