Hypothesis Testing Methods
Table of contents
Selecting the Right Method
As seen in the previous section, during hypothesis testing, we:
- Set up a null hypothesis and assume it true
- Calculate a test statistic from the real data to test against the null hypothesis
How one would set up the null hypothesis and what test statistic one would use depends on the type of data, number of samples, and the teting method.
What happens when you choose an inappropriate test?
Using a t-Test for Non-Normal Data
Suppose we use a t-test on a population without normality (and a small sample size).
What happens is, even if we set the significance level to 0.05, the probability of making a Type I error does not match the significance level.
If the tails are much skinnier than the t-distribution, then the probability of making a Type I error is much lower than 0.05.
This in turn has the effect of increasing the probability of making a Type II error.
This case is sometimes called conservative testing, because you are much more reluctant to accept the alternative hypothesis. Some may prefer this idea, but it still poses a problem.
If the tails are much fatter than the t-distribution, then the probability of making a Type I error is much higher than 0.05.
This is a big problem because it means that we are more prone to claiming something insignificant to be significant.
Combination of Data Types
There are two different types of data:
Suppose we are comparing two different variables. Depending on the combination of data types, the way we interpret our null hypothesis and test statistic will change.
So it is important to first determine the data that we’re working with before selecting a hypothesis testing method.
The difference in characteristic can be best illustrated with some figures.
Qualitative vs. Quantitative
For instance, suppose we were testing the effectiveness of a new drug by comparing some measurement (i.e. blood pressure) of people who take the drug and people who take a placebo.
Then, we’d have a bar plot like the following:
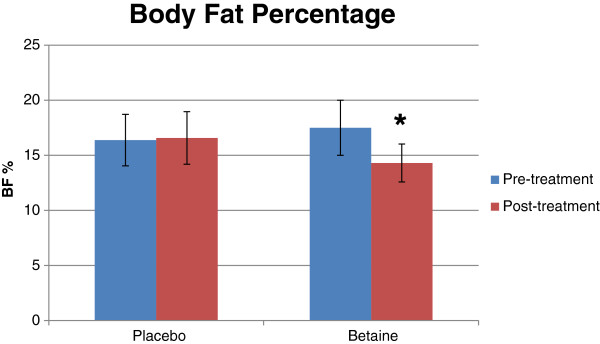
In this case, we have a qualitative variable (i.e. drug vs. placebo), and a quantitative variable (i.e. body fat).
Qualitative vs. Qualitative
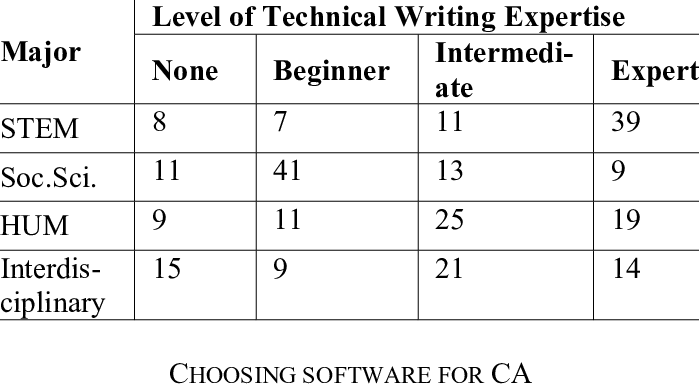
Contingency Table
When we have two qualitative variables, we can use a contingency table to visualize the data.
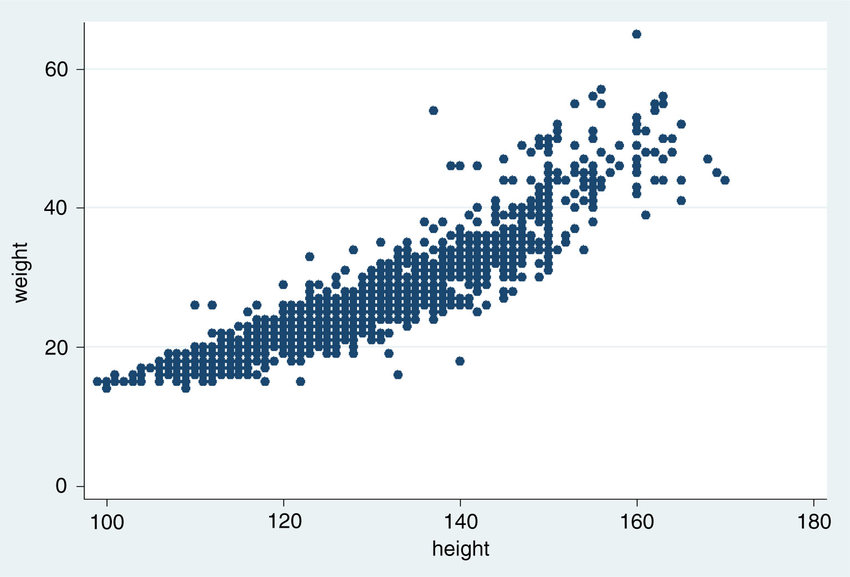
Quantitative vs. Quantitative
When we have two quantitative variables, we can use a scatter plot to visualize the data.
Distribution of Quantitative Variable
When we have a quantitative variable, it is important to understand the distribution of the variable before selecting a hypothesis testing method.
Parametric Test
Hypothesis testing that assumes a specific distribution for the population (mathematically defined by parameters) is called a parametric test.
For instance, the t-distribution assumes that the population distribution is normal.
Hence, any t-test that we perform will be based on the assumption that the population distribution is normal.
Normality
If a set of data has normality, then it means that it was sampled from a population that is normally distributed.
The majority of parametric tests assume that the population distribution is normal.
There are a few ways to check for normality:
- Quantile-Quantile (Q-Q) Plot: a graphical/visual method
- Shapiro-Wilk Test: a statistical method using hypothesis testing
- Kolmogorov-Smirnov (K-S) Test: a statistical method using hypothesis testing
When using hypothesis testing to check for normality, we set the null hypothesis to be that the data is normally distributed.
There is also the issue of test multiplicity, which is the problem of performing multiple hypothesis tests on the same data set, because we perform the normality test before performing the actual test.
Nonparametric Test
Not all data follow a certain mathematical distribution.
For data with asymmetry or outliers, statistics such as the mean and standard deviation are not reliable.
In such cases, parametric tests are not appropriate.
Hypothesis testing that does not depend on parameters, such as mean and standard deviation, is called a nonparametric test.
When the distributions in comparison are similar/identical:
- Wilcoxon Rank Sum Test
- Mann-Whitney U Test
When the distributions in comparison are different:
- Fligner-Policello Test
- Brunner-Munzel Test
Still not recommended for tests with extremely different distributions.
Assumption of Homogeneity of Variance
When we compare the means of groups of data, we often assume that all comparison populations have the same variance.
If the variance of all populations are the same, then we say that the they have homogeneity of variance.
Some of the hypothesis tests to test for homogeneity of variance are:
- Bartlett’s Test
- Levene’s Test
The null hypothesis would be that the populations have homogeneity of variance.
Number of Samples
Number of samples refers to the number of groups of data that we have.
Do not confuse this with the sample size $n$, which refers to the number of observations in a single group.
If we had a quantitative, single variable that approximates a normal distribution, then we would use a one-sample t-test.
If we had two quantitative variables that approximates a normal distribution, then we would use a two-sample t-test.
The most common case is when we have two groups of data, but there are cases where we have to make a comparison between more than two groups.
Multiple Comparison Problem
Why not just perform multiple pairwise t-tests?
Suppose we have $m$ pairs of groups. For each pair, the Type I error rate is $\alpha$.
When we perform $m$ two-sample t-tests, the probability of making at least one Type I error is equal to 1 minus the probability of never making a Type I error in any of the tests:
$$ 1 - (1 - \alpha)^m $$
This type of error rate is actually called the family-wise error rate (FWER).
For example, if we have 3 pairs of groups, and we set $\alpha = 0.05$, then the probability of making at least one Type I error is:
$$ 1 - (1 - 0.05)^3 = 0.1426 > 0.05 $$
Which is dangerously higher than the desired Type I error rate of $\alpha$.
This is called the multiple comparison problem (MCP).
How to Avoid the MCP
When there are more than two groups of data, we generally perform an omnibus test to test for significant difference between at least one pair of groups.
If the result of the omnibus test turns out to be significant, (as necessary to the purpose of your research) we perform a post-hoc test that either tries to correct our results from the previous test or performs an additional test to see exactly which pairs of groups are different.
Even though the name suggest otherwise, not all post-hoc tests pre-requisite a test like ANOVA. Some post-hoc tests like Bonferroni, Tukey, Dunnet, Williams, etc. can be used without ANOVA. Post-hoc tests are sometimes just called multiple comparison analysis as well.
In addition, even though the omnibus test turns out to be insignificant, a post-hoc test may report significance. This may occur if the statistics and distributions used for the pre and post tests are different. So it is worth performing a standalone multiple comparison analysis.
Tests for Multiple Comparison
- ANOVA: parametric test
- Kruskal-Wallis Test: nonparametric test
Multiple Comparison Analysis / Post-Hoc Test:
- Bonferroni Correction
- Tukey’s HSD Test: when comparing all groups to each other
- Steel-Dwass Test: nonparametric version of Tukey’s HSD Test
- Dunnett’s Test: when comparing all groups to a control group
- Steel Test: nonparametric version of Dunnett’s Test
- Williams Test: when you can rank/sort the groups into a specific order
- Scheffe’s Test
- Newman-Keuls Test
Hypothesis Testing for Qualitative Variable
When the population is quantitative, we often set up a hypothesis test about the population mean.
When the population is qualitative, we often set up a hypothesis test about:
$$ P: \text{probability of an event occurring in the population} $$
- Binomial test
- Chi-square test of goodness of fit
- Chi-square test of independence